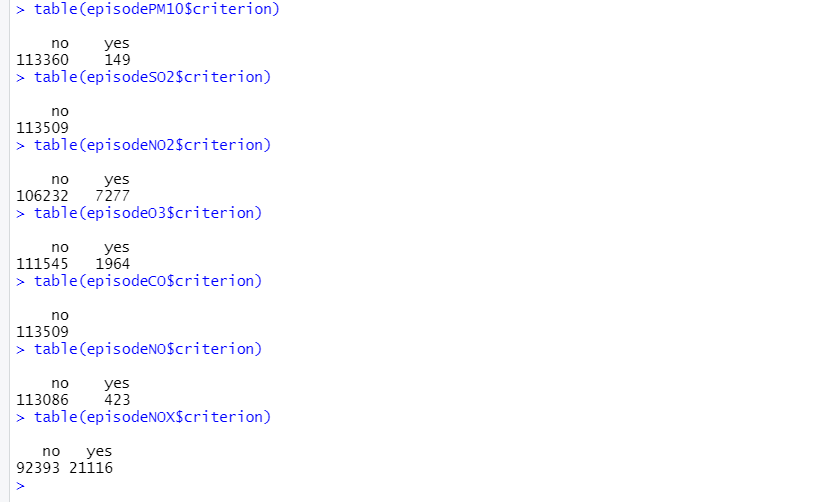
This is a test done in R Studio to see if certain pollutants exceeded the established concentration limits. This is done by creating the episodes of each pollutant with the pivotw1 document (like mydata but with the Barcelona Eixample data). Then only the criterion of each data set had to be analyzed. So, with a concentration of 50 and a period of 24 hours, the results were that:
(calculations made with a simple rule of three)
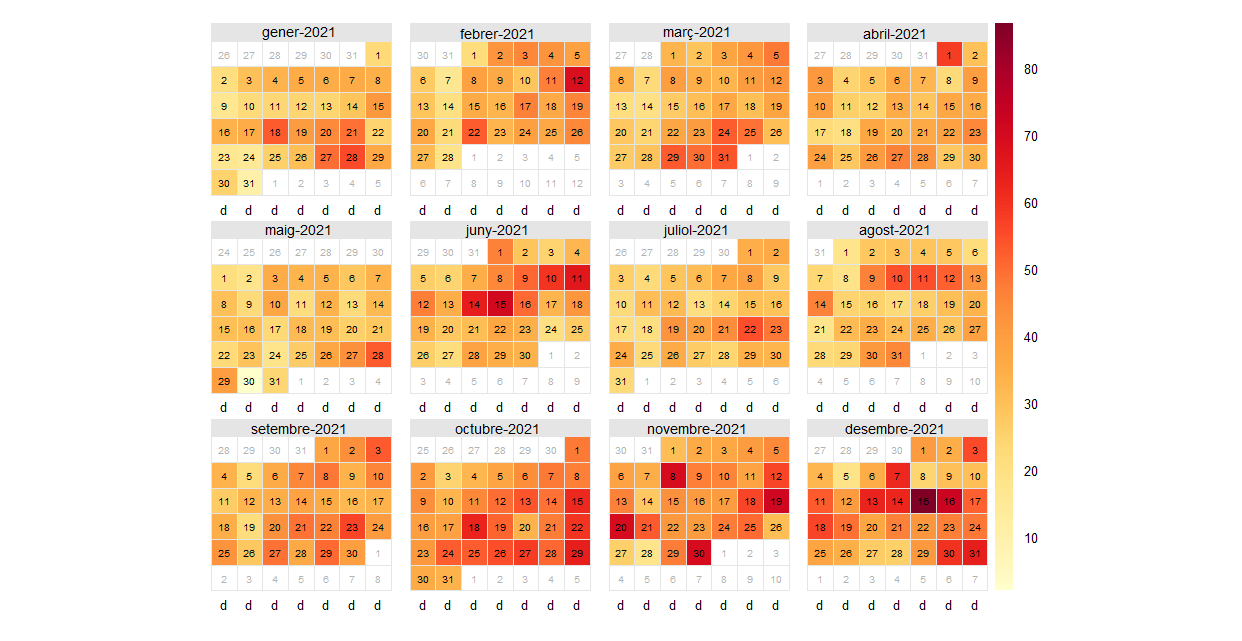
This is a Calendar Plot that shows the NO2 pollution levels, from 10 to 80, every day of the year 2021 on Barcelona Eixample. This is a strange case since the day with the most pollution (over a value of more than 80) does not correspond to any important event, in addition to the fact that it is a Friday. My deduction is that perhaps that day there was a fire in a house, since fire produces nitrogen oxides, such as NO2.
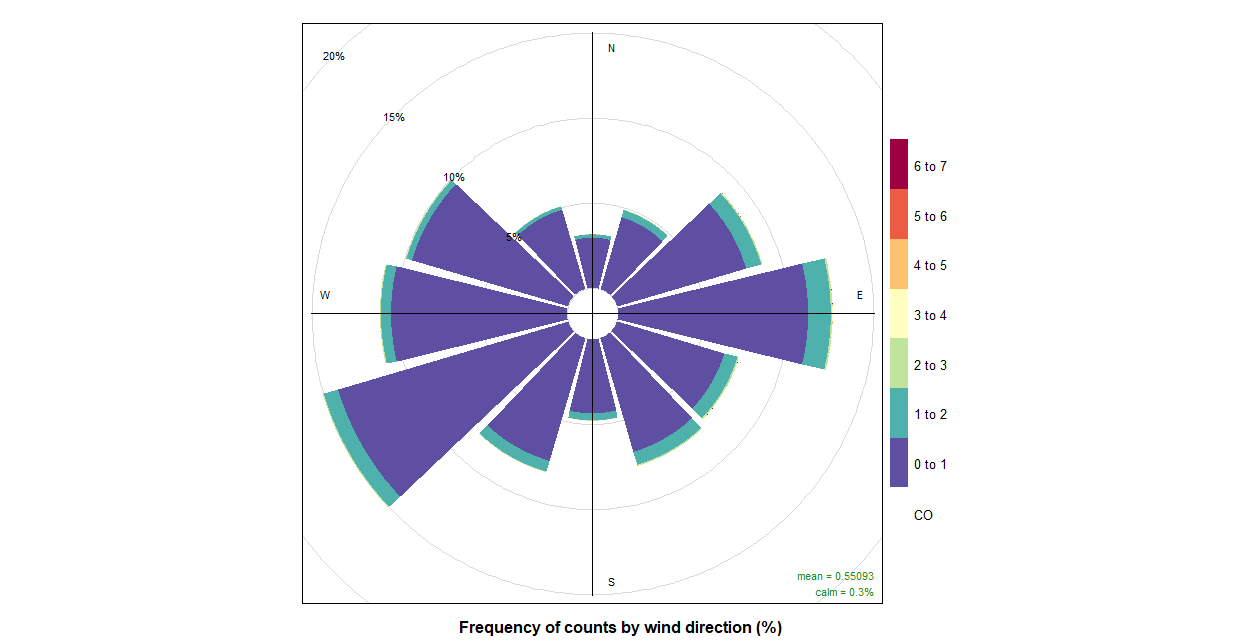
This is a Pollution Rose graph with CO, in this case it is held at extremely low levels (because this gas is produced by incomplete combustion, which does not occur in cities) and with the common force-direction.
This is a Pollution Rose graph with NO, in this case it is maintained with intermediate levels (with an average of 32.33) and with the common force-direction.
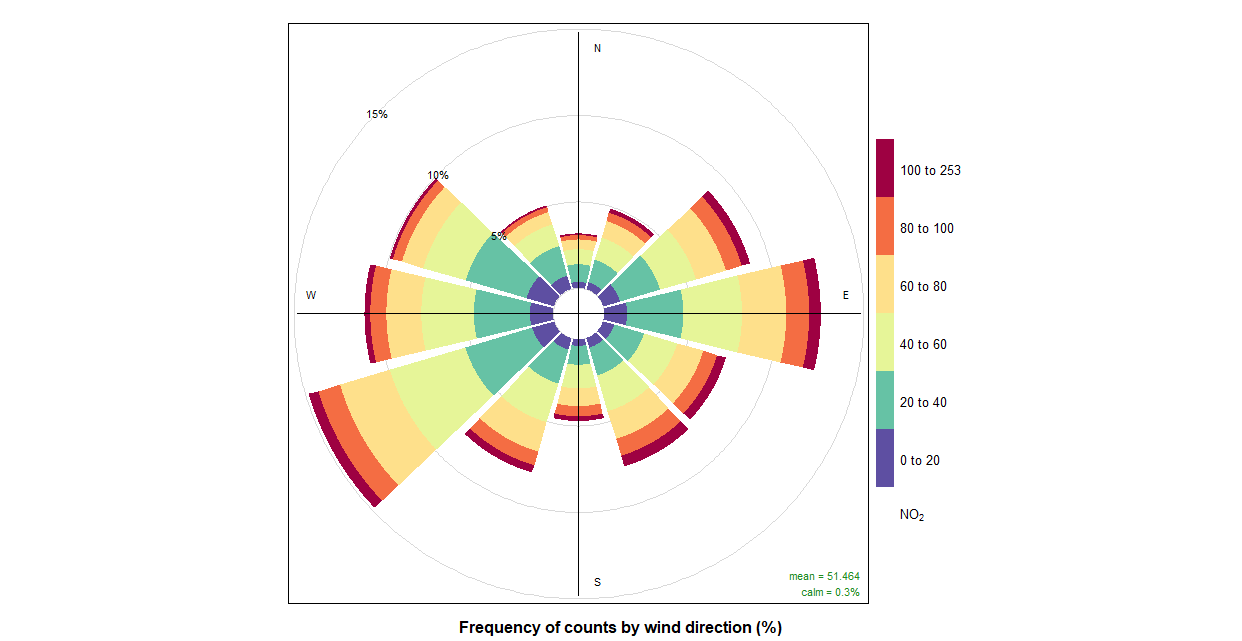
This is a Pollution Rose graph with NO2, in this case it is maintained with high levels (due to heavy traffic in city centers) and with the common force-direction of this zone.
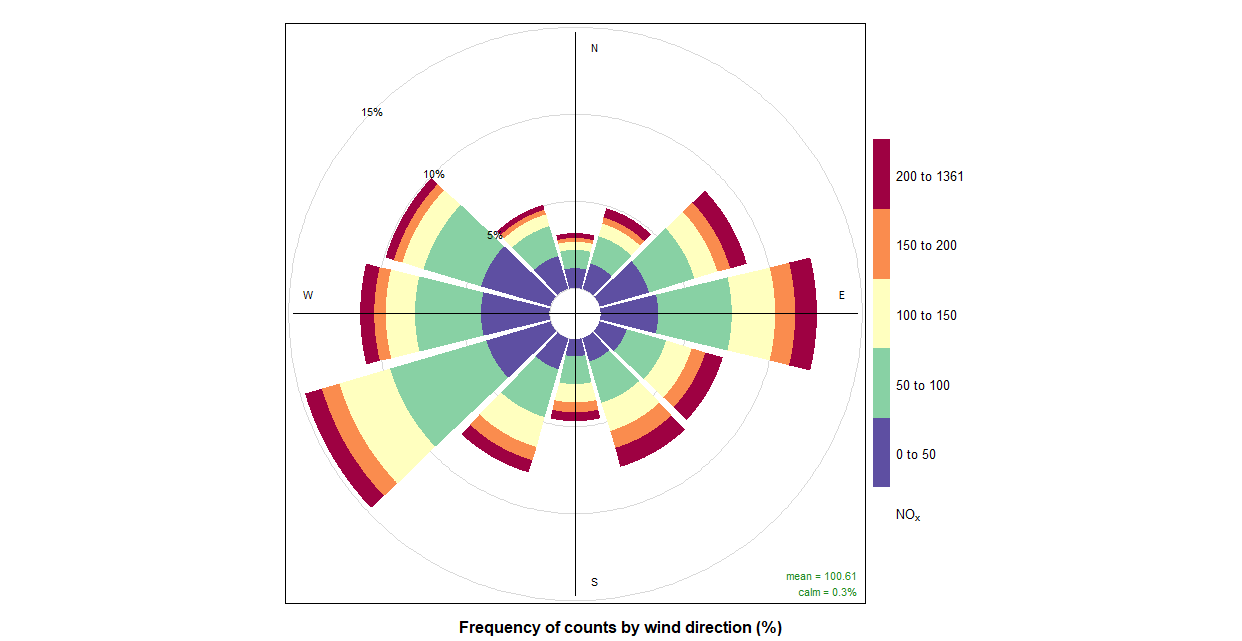
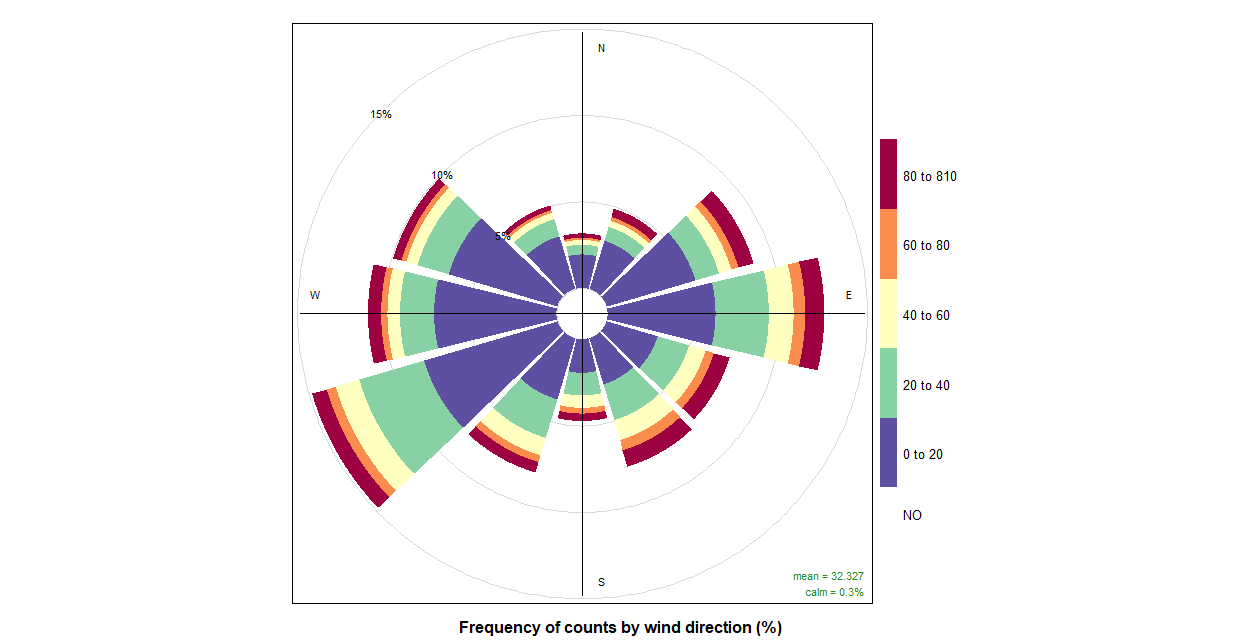
This is a Pollution Rose graph with NOX, in this case it is maintained with very high levels (because it is the main pollutant from vehicle combustion) and with the common force-direction.
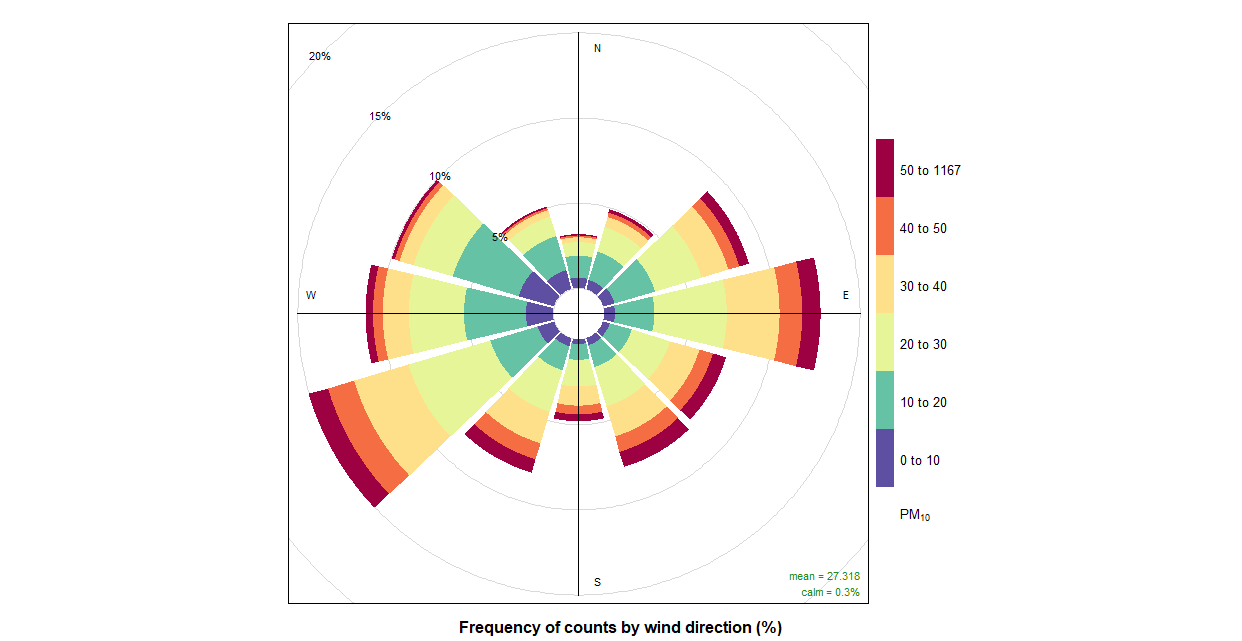
This is a Pollution Rose graph with PM10, in this case it is maintained with intermediate levels (with an average of 27.32) and with the common force-direction of Barcelona Eixample.
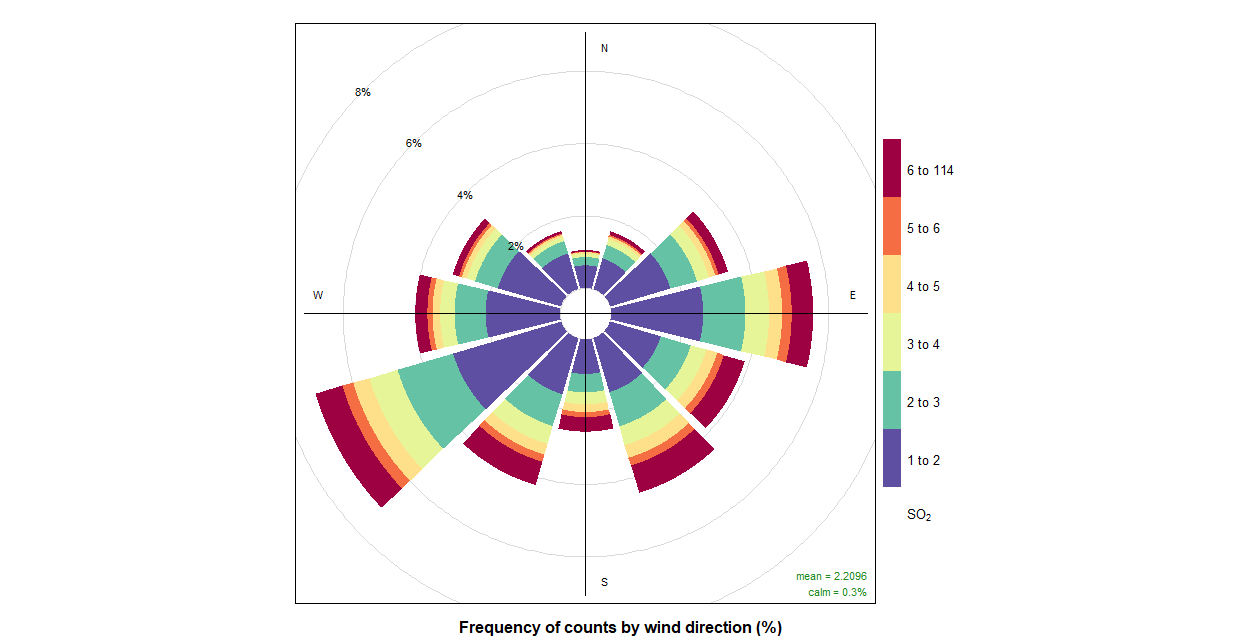
This is a Pollution Rose graph with SO2, in this case it is maintained with low levels (because it is a pollutant produced in the combustion of fossil fuels carried out mainly in high-temperature industrial processes and electricity generation) and with the common force-direction.
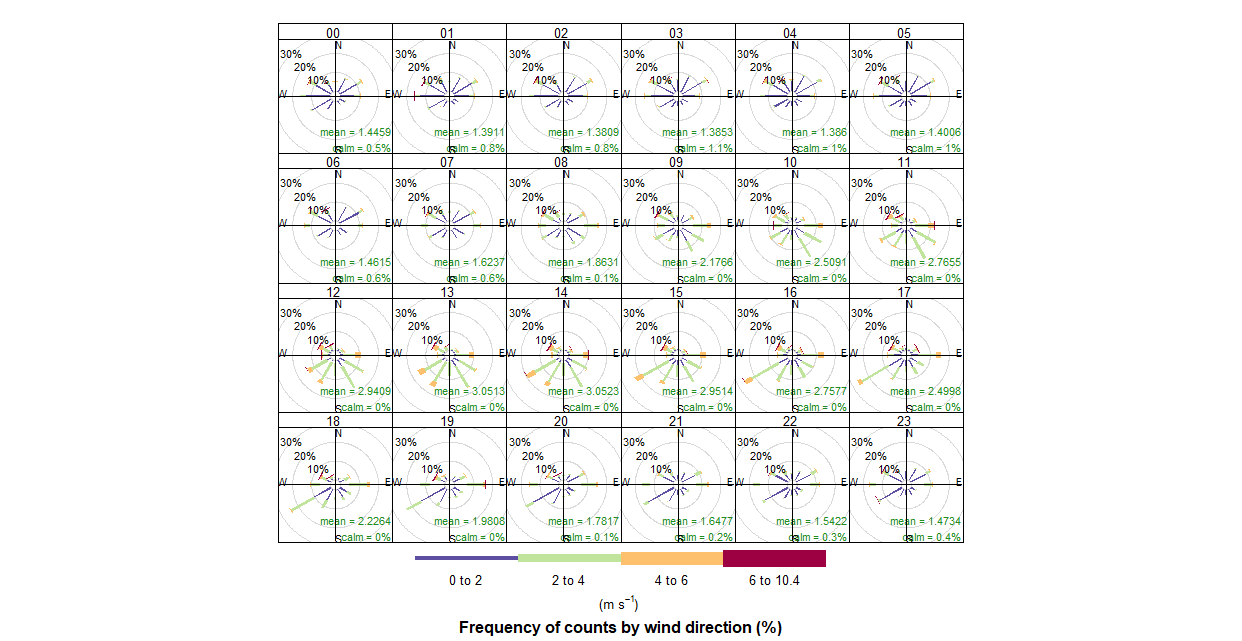
This graph shows the average wind speed of Barcelona Eixample (without specific components) during the 24 hours of the day, in m/s.
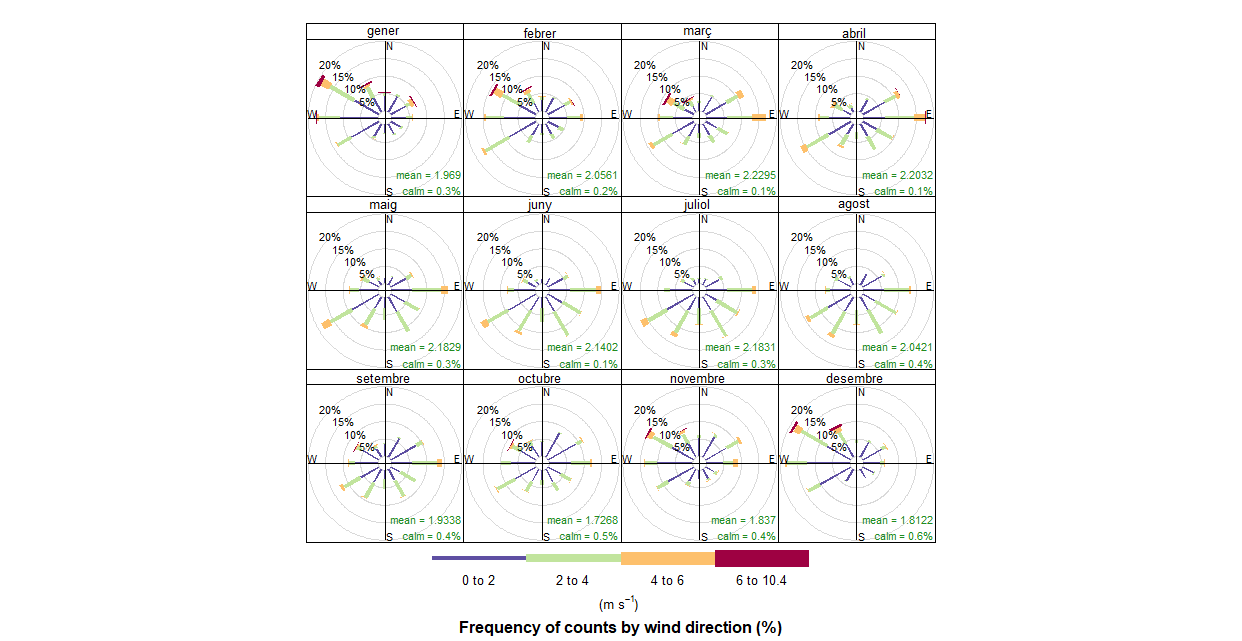
This graph shows the average wind speed of Barcelona Eixample (without specific components) during the twelve months of the year, in m/s.
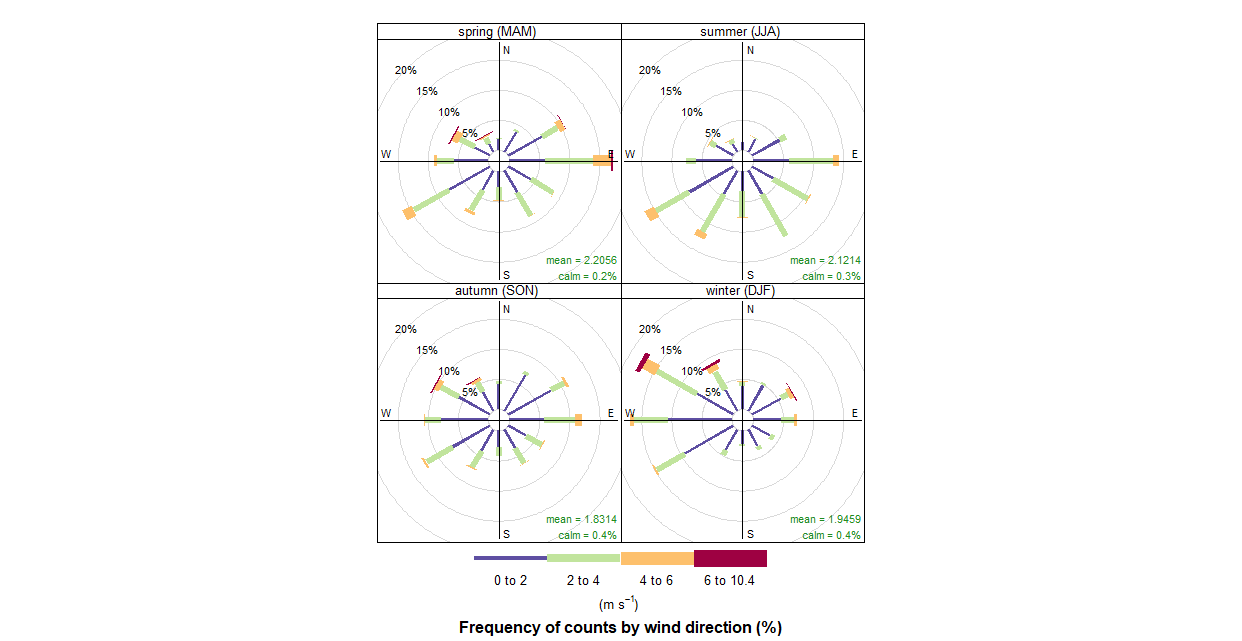
This graph shows the average wind speed of Barcelona Eixample (without specific components) during the four seasons of the year, in m/s.
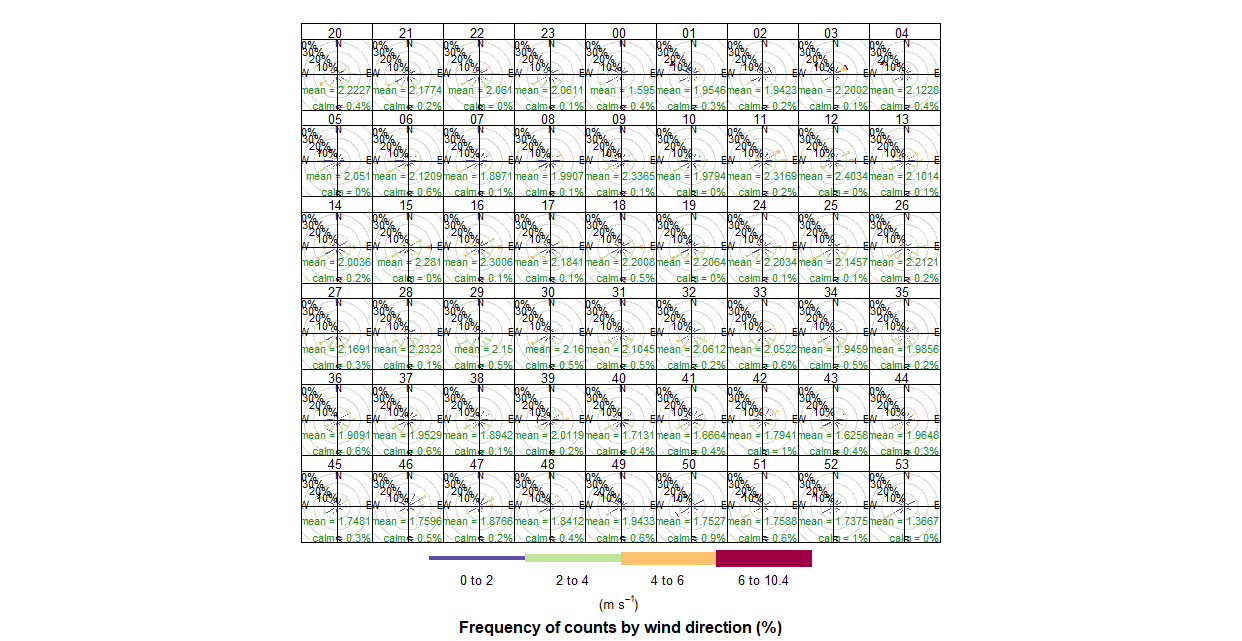
This graph shows the average wind speed of Barcelona Eixample (without specific components) during the 53 weeks of the year, in m/s.
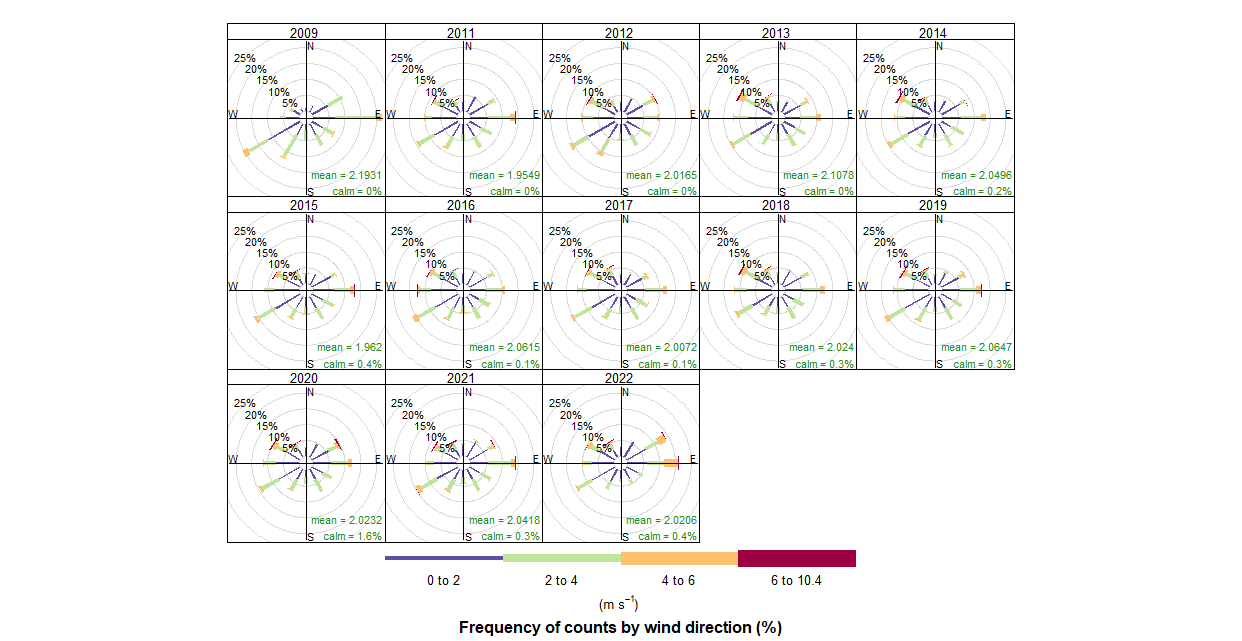
This graph shows the average wind speed of Barcelona Eixample (without specific components) from 2009 to 2022, in m/s.
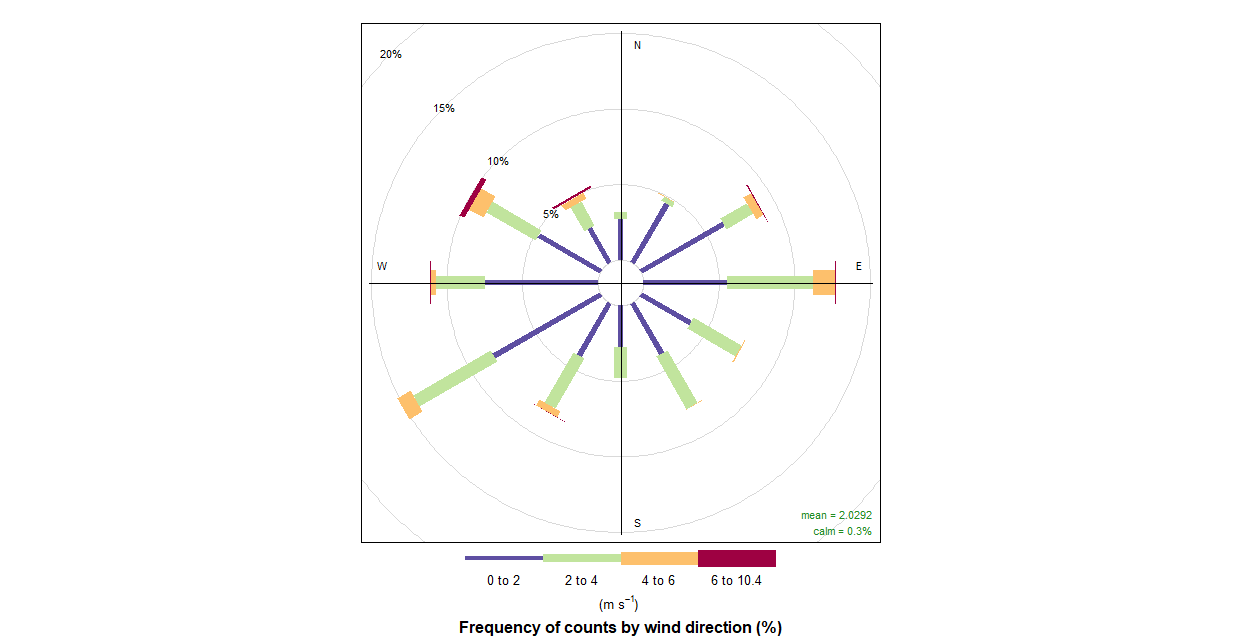
This graph shows the force of the wind depending on the direction, in this case we have not fixed any specific pollutant but we can see how it has the same structure as almost all the wind graphs, due to the environment in which the Eixample neighborhood is located.
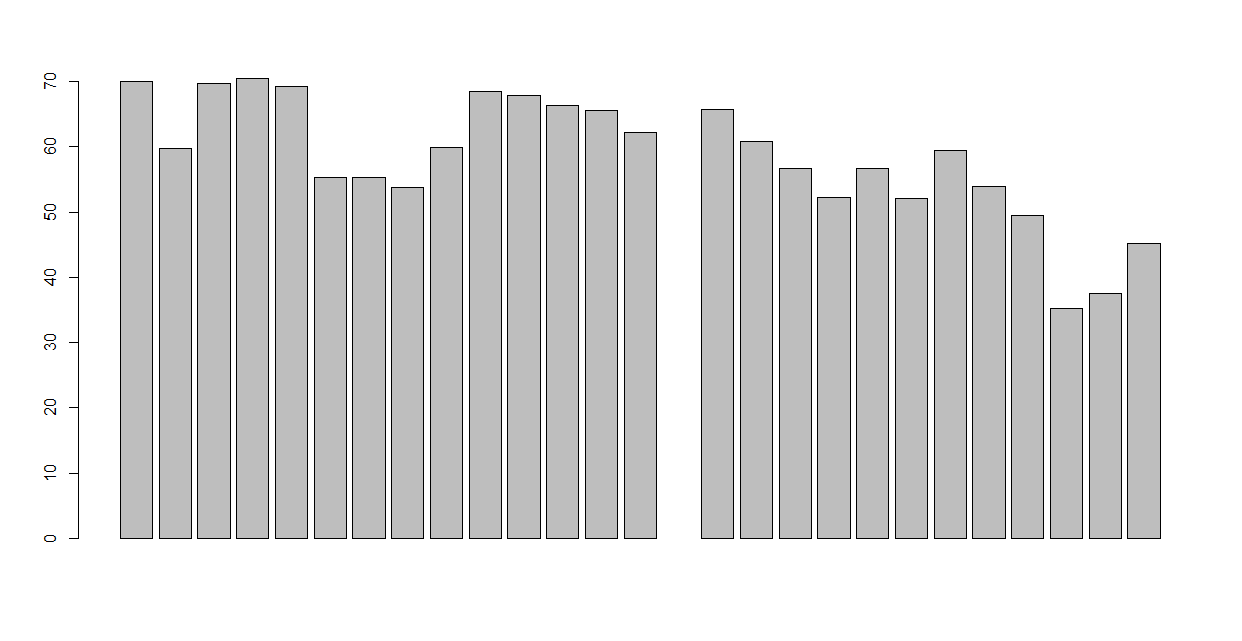
This simple graph appeared to us inadvertently while we were testing with R Studio, it does not have the x-axis values marked but we assume that it is a Yearly Barplot graph that represents the general contamination for 27 years, one of them being without values.
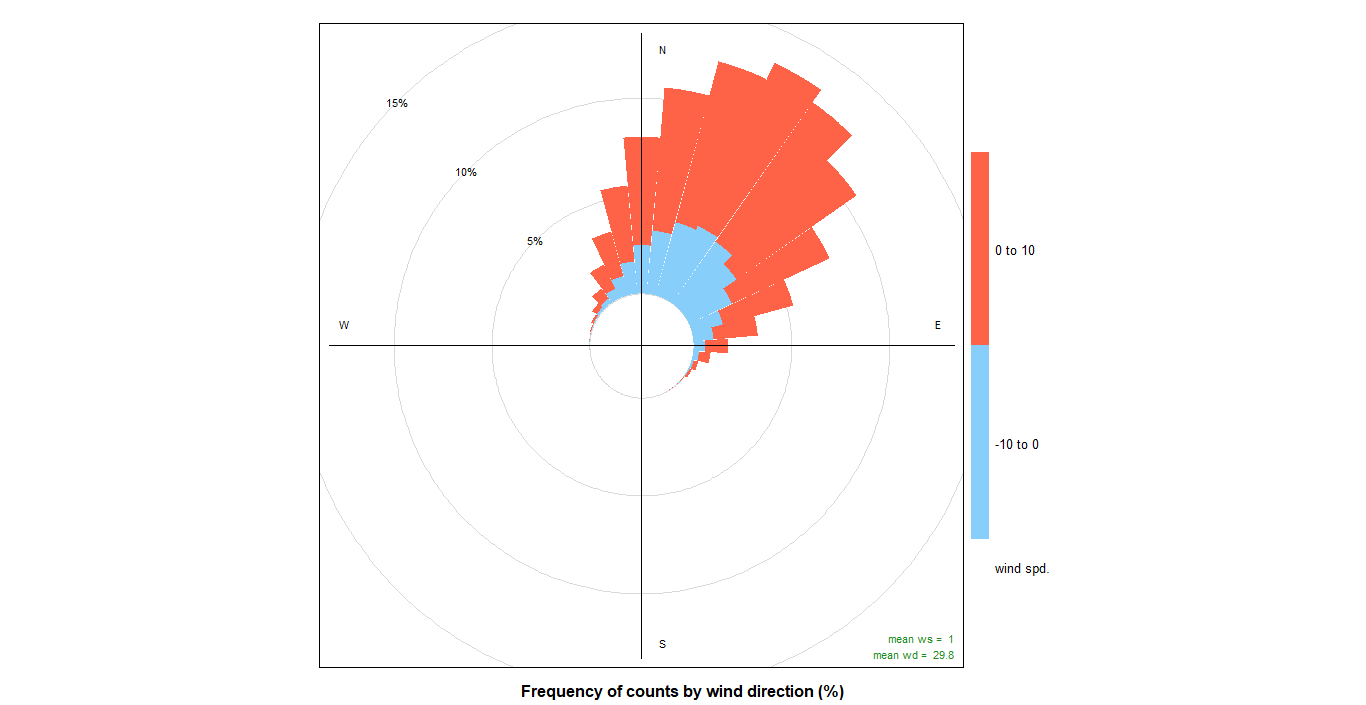
This is another curious and unnecessary graph, in this case it shows the wind speed of Martorell, mostly from 0 to 10 m/s, in a northeasterly direction.
The main problem of this work, which we have been dragging throughout the quarter, is that we have been working with data on air pollution in Martorell. This is because we have all used the "mydata" cloud document to create the charts, and this was created last year in another CMC job.
To solve it, what we have had to do is create our own "mydata", with the data of our city. For this we have had to create a document called "pivotw" from the cityall. To this one only had to transform the data of the pollutant column to other individual columns. Finally, another problem that appeared is that this data was of "list" class, so it was not possible to make graphs with it. To fix it, we have had to unlist these data and transform them all into a "numeric" type, finally creating the pivotw1 document, with which we have been able to obtain absolutely all the graphics of the project.
In short, the Eixample district of Barcelona is an area contaminated mainly by the gases produced by the combustion of vehicles (nitrogen oxides) and homes (carbon monoxide). In addition, because of the port that contains the city, there are also large amounts of pollution due to the combustion of ships. On the other hand, the city is surrounded by highways, so it is an added value of NO2. Fortunately, the city is free of polluting industries for a few kilometers around, so the levels of water vapours, carbon dioxide, methane, nitrogen oxides, ozone and CFCs (chlorofluorocarbons) remain low.
Looking at the wind charts, the average wind speed in Barcelona has slight seasonal variations over the course of the year. The windier part of the year lasts for 7 months, from October 2 to April 30, with average wind speeds of more than 12.4km/h. The windiest month of the year in Barcelona is December, with winds at an average speed of 13.6km/h. On the other hand, the calmer time of year lasts for 5 months, from April 30 to October 2. The calmest month of the year in Barcelona is July, with winds at an average speed of 11km/h. In addition, we can deduce that where the most wind comes from is always from the east since we have the Mediterranean Sea, which provides us with strong wind currents.
In short, in Barcelona Eixample traffic should be reduced, and efforts are already being made, carrying out quality controls on vehicles and prohibiting the entry of older ones, as well as creating "urban islands" on some of the busiest roads in the city. the neighborhoods. If this works, we could avoid many annual deaths due to pollution that affects more than 50% of the citizens of this district.